


Scatterplots and Regressions
Purplemath
The point of collecting data and plotting the collected values is usually to try to find a formula that can be used to model a (presumed) relationship. For instance, you could run experiments timing a ball as it drops from various heights, and you would be able to find a definite relationship between "the height from which I dropped the ball" and "the time it took to hit the floor". On the other hand, you could collect reams of data on the colors of people's eyes and the colors of their cars, only to discover that there is no discernable connection between the two data sets.

(I said "(presumed) relationship" above because the researcher may end up concluding that there isn't really any relationship where he'd hoped there was one. This is where that old statistical proverb comes into play. "Correlation is not causation" means that, just because A has a strong correlation with B, doesn't mean that A causes B, nor even that B causes A. It may be that there is some back-end issue C that's causing both of A and B. Or it may be that the correlation is just an artefact [that is, a happenstance result of] the "big data" that was being crunched. Examples of these fallacious correlations have become Internet memes, many of which have now been turned into a book. So always remember, when doing correlations, that all we're looking for is any apparent match of data sets. We're not "proving" anything about anything, other than that two data sets appear to correlate, to some degree, in some fashion.)
The process of taking our data points and coming up with an equation is called "regression", and the graph of the "regression equation" is called "the regression line". If we're doing our scatterplots by hand, we may be told to find a regression equation by putting a ruler against the first and last dots in the plot, drawing a line, and guessing the line's equation from the picture.
This is an incredibly clumsy (and dumb) way to proceed, and can give very wrong answers, especially since values at the ends often turn out to be outliers (that is, turn out to be data points that don't quite fit with everything else).
For instance, suppose our dots look like this:

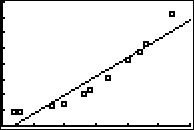
Connecting the first and last points, we would end up with this:

This is very clearly very, very, very wrong.
On the other hand, we could ignore the outliers and instead just eyeball the cloud of dots to locate a general trend. We'd put the ruler about where we think a line ought to go (regardless of whether the ruler actually crosses any of the dots), draw the line, and guess the equation from that. We'll likely end up with a more sensible result. Our equation will still be guess-work, but it'll be better guess-work than using only the first and last points. Our line might look something like this:

If you're told to find regression equations by using a ruler, you'll need to work extremely neatly; using graph paper might be a really good idea. (It's not necessary to buy pads of graph paper; free printables are available online.) Once you've drawn in your line (and this will only work for linear, or straight-line, regressions), you will estimate two points on the line that seem to be close to where the gridlines intersect, and then find the line equation through those two points. From the above graph, I would guess that the line goes close to the points (3, 7) and (19, 1), so the regression equation would be y = (−3/8)x + 65/8.
Most likely, though, you'll be doing regressions in your calculator. Doing regressions properly is a difficult and technical process, but your graphing calculator has been programmed with the necessary formulas and has the memory to crunch the many numbers. The calculator will give you "the" regression line. If you're working by hand, you and your classmates will get slightly different answers; if you're using calculators, you'll all get the same answer. (Consult your owners manual or calculator web sites for specific information on doing regressions with your particular calculator model.)
If we're supposed to report how "good" a given regression is (that is, how well the equation you've generated matches the data points they gave you), then we'll want to figure out how to find the "r", "r2", and/or "R2" values in our calculators. These diagnostic tools measure the degree to which the regression equation matches the scatterplot. The values for correlation evaluations are between −1 and +1. The closer these correlation values are to 1 (or to −1), the better a fit our regression equation is to the data values.
If the correlation value (being the "r" value that our calculators spit out) is between 0.8 and 1, or else between −1 and −0.8, then the match is judged to be pretty good. On the other hand, if the value is between −0.5 and 0.5 (or between −0.3 and +0.3, depending on the textbook), then the match is judged to be pretty poor. A correlation value close to zero means that we're kidding ourselves if we think there's really a relationship (that is, an equation for the dots) of the type we're looking for.
(There should be instructions, somewhere in the owners manual for your graphing calculator, for finding this information. Check the manufacturer's website for downloads, if you've lost the manual that came with your calculator.)
When we're doing a regression, we're trying to find the "best fit" line to the data, and the correlation numbers help us to measure how good our "fit" actually is.
-
Given the following data values, find the linear and cubic regression lines. Say which regression is a better fit, and why.
(2, 23), (3, 24), (8, 32), (10, 36), (13, 51), (14, 59), (17, 76), (20, 107), (22, 120), (23, 131), (27, 182)
I'll start by plugging these data points into the stat utility in my graphing calculator. With the viewing window set to display my "Stat Plot", I get the following display:

Looking at the display, I'm pretty sure I'm seeing a curvy line. This does not look like a straight line (that is, a linear regression equation) would be a good fit to the plotted points. So I'm expecting my correlation to be better when I'm doing the cubic regression.
(The graph above wasn't strictly necessary, but I find it helpful, as it tells me what I should probably be expecting.)
Once I've plugged these values into the stat utility of my calculator, I can then do a linear regression. First, I go to the stat utility, and select "calc", because I'm going to be asking the calculator to calculate a regression equation for me. I'll do the linear regression first, so I select "LinReg":

When I hit enter, I get the following screen:

This tells me that the best-fit straight line through the points is approximately:
y = 6.026x − 10.645
Note that the r2 coefficient is displayed because I have set my calculator to "DiagnosticsOn". This option was available to me in the "Catalog" of my calculator. Once I'd turned it on, it'll be on until I decide to turn it off... which I won't. Books and instructors vary; they may want the plain "r" value. Use whichever they tell you to use.
I can plug the above equation into my calculator, and have it graph the line on the same screen as the data points:
As I'd expected, this straight line doesn't look like a good fit to the data. The value of r2 is about 0.903, which isn't terrible, but I strongly suspect that this is not the best I can do.

I'll check if the cubic regression is any better. The data points are the same values, but now I'll select "CubicReg" for the type of equation I'm wanting.

The calculator gives me this:

I notice that, because I'm not working with a linear regression this time, the calculator gave me only the "R2" value, which is about 0.999. This is indeed better than what I got for the linear regression. The equation the calculator gave is is approximately:
y = 0.000829x3 + 0.233x2 − 1.09x + 24.60
Graphing this equation together with the scatterplot dots, I get:

This equation is very clearly a much better match to the points, confirming expectations from the original scatterplot. And I can justify saying that the cubic regression is better, because of the r2 and R2 values. In other words, the graphs are helpful, but I can do the "explain why" part with the correlation values.
The cubic equation y = 0.000829x3 + 0.23x2 − 1.09x + 24.60 is the better regression. This is because the correlation value for the cubic regression is about 0.999, which is closer to 1 than is the linear correlation value of 0.903, and because the graph of the cubic model is seen to be a closer match to the dots in the scatterplot than is the linear model.
By the way, you shouldn't expect always to get correlation values that are close to "1". If they tell you to find, say, the linear regression equation for a particular data set, and the correlation factor ends up being close to zero, this doesn't mean that you've found the "wrong" linear equation; it only means that a linear equation probably wasn't a good model to the data. A quadratic model, for instance, might have been better.
© 2024 Purplemath, Inc. All right reserved. Web Design by ![]()